OSWatcher (oswbb) is a collection of UNIX shell scripts intended to collect and archive operating system and network metrics to aid support in diagnosing performance issues. It is small, simple and easy to use, but not that killer tool at all… but you get come graphs and a report with some “clicks” and you mind find issues you could further investigate…
OS Watcher
OS Watcher
A small and nice tool provided by Oracle to analyze your system performance:
Oracle Support Document 461053.1 (OSWatcher Analyzer User Guide) can be found at: https://support.oracle.com/epmos/faces/DocumentDisplay?id=461053.1
This would start the tool and collect data at 30 second intervals and log the last 1 hours of data to archive files
root@solaris:/h/u/user# tar xf oswbb734.tar
root@solaris:/h/u/user# cd oswbb
root@solaris:/h/u/user/oswbb# ls
analysis                   Exampleprivate.net         OSWatcher.sh               oswsub.sh                  tar_up_partial_archive.sh
call_du.sh                 ifconfigsub.sh             OSWatcherFM.sh             profile                    tarupfiles.sh
call_sar.sh                iosub.sh                   oswbba.jar                 psmemsub.sh                vmsub.sh
call_uptime.sh             ltop.sh                    oswib.sh                   src                        xtop.sh
docs                       mpsub.sh                   oswnet.sh                  startOSWbb.sh
Example_extras.txt         nfssub.sh                  oswrds.sh                  stopOSWbb.sh
root@solaris:/h/u/user/oswbb#
root@solaris:/h/u/user/oswbb#
root@solaris:/h/u/user/oswbb#
root@solaris:/h/u/user/oswbb# ./startOSWbb.sh 30 1
root@solaris:/h/u/user/oswbb# Setting the archive log directory to/h/u/user/oswbb/archive

Testing for discovery of OS Utilities...
VMSTAT found on your system.
IOSTAT found on your system.
MPSTAT found on your system.
IFCONFIG found on your system.
NETSTAT found on your system.
TOP found on your system.

Testing for discovery of OS CPU COUNT
oswbb is looking for the CPU COUNT on your system
CPU COUNT will be used by oswbba to automatically look for cpu problems

CPU COUNT found on your system.
CPU COUNT = 8

Discovery completed.

Starting OSWatcher v7.3.3  on Wed Mar 29 10:50:22 CEST 2017
With SnapshotInterval = 30
With ArchiveInterval = 1

OSWatcher - Written by Carl Davis, Center of Expertise,
Oracle Corporation
For questions on install/usage please go to MOS (Note:301137.1)
If you need further assistance or have comments or enhancement
requests you can email me Carl.Davis@Oracle.com

Data is stored in directory: /h/u/user/oswbb/archive

Starting Data Collection...

oswbb heartbeat:Wed Mar 29 10:50:27 CEST 2017
[...]
oswbb heartbeat:Wed Mar 29 12:10:45 CEST 2017
<ctrl z>
root@solaris:/h/u/user/oswbb#
root@solaris:/h/u/user/oswbb#
root@solaris:/h/u/user/oswbb# ./stopOSWbb.sh
root@solaris:/h/u/user/oswbb# java -jar oswbba.jar -i ./archive/

Starting OSW Analyzer V7.3.3
OSWatcher Analyzer Written by Oracle Center of Expertise
Copyright (c)  2014 by Oracle Corporation

Parsing Data. Please Wait...

This directory already exists. Rewriting...
Scanning file headers for version and platform info...


Parsing file solaris_iostat_17.03.29.1100.dat ...
Parsing file solaris_iostat_17.03.29.1200.dat ...


Parsing file solaris_vmstat_17.03.29.1100.dat ...
Parsing file solaris_vmstat_17.03.29.1200.dat ...

Parsing file solaris_netstat_17.03.29.1100.dat ...
Parsing file solaris_netstat_17.03.29.1200.dat ...


Parsing file solaris_top_17.03.29.1100.dat ...
Parsing file solaris_top_17.03.29.1200.dat ...


Parsing file solaris_ps_17.03.29.1100.dat ...
Parsing file solaris_ps_17.03.29.1200.dat ...


Parsing Completed.


Enter 1 to Display CPU Process Queue Graphs
Enter 2 to Display CPU Utilization Graphs
Enter 3 to Display CPU Other Graphs
Enter 4 to Display Memory Graphs
Enter 5 to Display Disk IO Graphs

Enter 6 to Generate All CPU Gif Files
Enter 7 to Generate All Memory Gif Files
Enter 8 to Generate All Disk Gif Files

Enter L to Specify Alternate Location of Gif Directory
Enter T to Alter Graph Time Scale Only (Does not change analysis dataset)
Enter D to Return to Default Graph Time Scale
Enter R to Remove Currently Displayed Graphs

Enter A to Analyze Data
Enter S to Analyze Subset of Data(Changes analysis dataset including graph time scale)

Enter P to Generate A Profile
Enter X to Export Parsed Data to File
Enter Q to Quit Program

Please Select an Option:
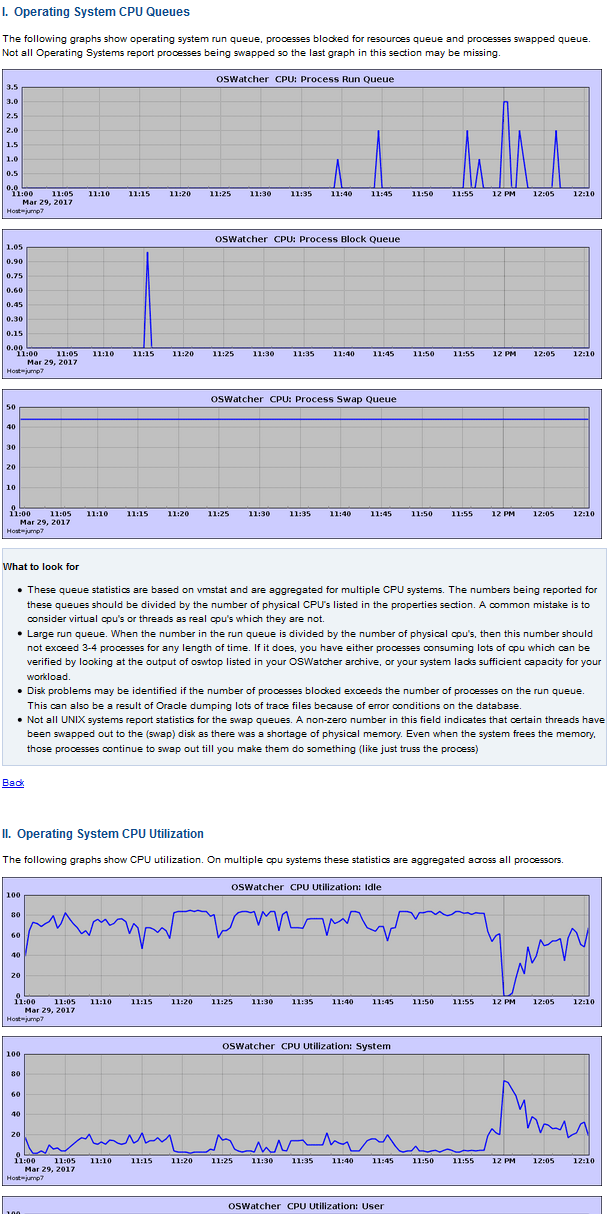
easy… after generating some graphs you can create a profile and open it with your browser:

Also the text report (enter A to analyze) is ok… nice overview, ToC:
###########################################################################
# Contents Of This Report:
#
# Section 1: System Status
# Section 2: System Slowdowns
#   Section 2.1: System Slowdown RCA Process Level Ordered By Impact
# Section 3: System General Findings
# Section 4: CPU Detailed Findings
#   Section 4.1: CPU Run Queue:
#   Section 4.2: CPU Utilization: Percent Busy
#   Section 4.3: CPU Utilization: Percent Sys
# Section 5: Memory Detailed Findings
#   Section 5.1: Memory: Process Swap Queue
#   Section 5.2: Memory: Scan Rate
#   Section 5.3  Memory: Page In:
#   Section 5.4  Memory: Page Tables (Linux only):
#   Section 5.5: Top 5 Memory Consuming Processes Beginning
#   Section 5.6: Top 5 Memory Consuming Processes Ending
# Section 6: Disk Detailed Findings
#   Section 6.1: Disk Percent Utilization Findings
#   Section 6.2: Disk Service Times Findings
#   Section 6.3: Disk Wait Queue Times Findings
#   Section 6.4: Disk Throughput Findings
#   Section 6.5: Disk Reads Per Second
#   Section 6.6: Disk Writes Per Second
# Section 7: Network Detailed Findings
#   Section 7.1  Network Data Link Findings
#   Section 7.2: Network IP Findings
#   Section 7.3: Network UDP Findings
#   Section 7.4: Network TCP Findings
# Section 8: Process Detailed Findings
#   Section 8.1: PS Process Summary Ordered By Time
#   Section 8.2: PS for Processes With Status = D or T Ordered By Time
#   Section 8.3: PS for (Processes with CPU > 0) When System Idle CPU < 30% Ordered By Time
#   Section 8.4: Top VSZ Processes Increasing Memory Per Snapshot
#   Section 8.5: Top RSS Processes Increasing Memory Per Snapshot
#
###########################################################################